Overview:
After a decade of significant growth in the 1990s, the structured cabling systems market has struggled in recent times and the market has stalled. Frank Murawski, President of FTM Consulting Inc., stated, “As we first reported, the onset of market saturation occurred in 1999 because most large firms had already installed their initial LANs. This resulted in the first drop in market growth. The market went from consecutive years of double-digit growth in the 1990s to a small, single-digit growth in 1999.” Compounding the market decline in 2000 was the U.S. economic slowdown, which caused the market to experience its first negative growth. For the next three years, market growths through 2003 were soft with minimal or no growth in the primary markets. In addition, the aftermarket for structured cabling systems hardly matched the cabling shipments in the previous years for the initial LAN installations. Further, the lack of new office building construction during this period considerably reduced the need for new structured cabling systems.
By 2004, the market recovered slightly with a small single-digit positive growth primarily due to new Web applications, add-ons, and to a lesser extent, PC replacement upgrades. In many cases the PC upgrades could use the existing cabling infrastructure if the network transmissions did not increase.
With this as a backdrop, it appears as if the market could continue to stagnate in the future. However, our recently released study, “Structured Cabling Systems Market: 2005,” indicates a resumption of double digit growth starting next year. This renewed growth will be driven by the need for network congestion relief in those networks experiencing bottlenecks, such as the data centers. The need for higher speeds will primarily include Gigabit Ethernet speeds in excess of 1 Gbps. This will require fiber cabling, as copper cabling will not provide the performance required. Our analysis indicates that copper UTP cabling will under perform for speeds in excess of 1 Gbps over longer distances.
(Click tor enlarge)
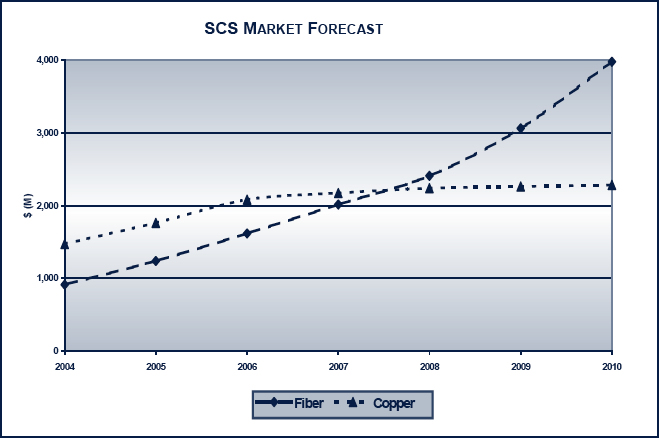
The above chart indicates a watershed event!
Fiber cabling will exceed UTP cabling for the first time.
- What applications will drive the need for fiber cabling?
- Which are the highest growth cabling applications in the future?
- What is the role of UTP cabling in the future?
- What has been the SCS market growth during the past several years?
- Which cabling applications will drive double-digit growth over the next 5years — fiber or copper cables, Gigabit Ethernet (GbE) or legacy uses, SM or MM fiber cables, Category of UTP cables, other segmentations?
We project a major shift in the market by 2008, when, for the first time, fiber cabling shipments exceed copper UTP cabling shipments. Copper has always dominated the market. Fiber cabling is expected to become the dominant cabling media for structured cabling system applications, such as data centers, campus and Fiber-to-the-Zone (FTTZ). In addition, fiber cabling will continue to be the dominant cabling used in riser cabling subsystems.
We project that copper UTP cabling will continue to dominate the horizontal cabling subsystem market in the future. Fiber-to-the-Desk (FTTD) will remain illusive, being a small percentage of the total horizontal cabling subsystem market in the future. FTTD will be found mainly in niche applications, in which speeds of 10 Gbps or higher are required at the workstations. For example, CAD or CAM terminals or any workstation handling a great deal of video feeds will be the typical application implementing FTTD in the future.
According to this study, fiber cabling shipments are forecast to grow from $1.2 billion in 2005, at a growth rate of 26.3%, to $4.0 billion by 2010. The highest growth application is expected to be data centers.
This new study from FTM Consulting, Inc. provides all of the detailed product forecasts segmented by applications, by Gigabit Ethernet and by type of cable (SM, MM, Cat 5, Cat 5e, Cat 6, etc.).
Table of Contents
Chapter 1
Introduction
- Study Objectives
- Structured Cabling Systems Market Evolution
- Methodology/Sources
- General Notes
Chapter 2
Executive Summary
- Structured Cabling Systems Development
- Total Structured Cabling System Market Forecast
- Structured Cabling System Market by Media Types Forecast
- Fiber Cable Forecast by Application
Chapter 3
SCS Market Evolution
- Early Embryonic Stage
- Mid Growth Stage
- Recent Saturation Stage
- Fiber Cable Evolution
- Gigabit Era Arrives
Chapter 4
Market Characteristics
- Market Changing
- Market Key Current Characteristic: Saturation
- Market Applications
- New Market Opportunities
Chapter 5
Product Developments
- New Laser Optimized Fiber Cables
- New Structured Cabling System Offerings
- Standard Fiber Optical Connector
- Video Cabling Trends
- Limited Combustible Cables
Chapter 6
Technology Trends
- 10 Gbps Over UTP Cabling Analysis
- VCSEL Higher Wavelength Technology
Chapter 7
Industry /Standards Developments
- Industry Structure
- Fiber Cabling Industry
- Industry Consolidations
- One Stop Shopping
- Standards Status
Chapter 8
Total Cabling Systems Market Forecast
- Total SCS Market Forecast
- Total SCS Market by Media Forecast
- SCS Market Product Segment Forecast
Chapter 9
Port Forecasts
- Total Port Forecasts
- Fiber Port Forecasts by Application
- Fiber Port Forecasts by Legacy-GbE
- Riser Fiber Port Forecasts
- Campus Fiber Port Forecasts
- FTTZ Fiber Port Forecasts
- FTTD Fiber Port Forecasts
- Data Center Port Forecasts
- Wireless Port Forecasts
- Copper Port Forecasts
Chapter 10
Cable Forecasts
- Total Cable Forecast
- Fiber Cable Volume Forecasts
- Fiber Cable Volume Forecast by Applications
- Fiber Cable Volume Forecasts by Legacy-GbE
- Fiber Cable Volume Forecast by SM-MM
- Fiber Cable Value Forecast by Application
- Copper Cable Volume Forecast by Category
- Copper Cable Volume Forecast by Legacy-GbE
- Copper Cable Volume Forecast by Plenum-Non-Plenum
- Copper Cable Value Forecast by Categories
- Copper Cable Value Forecast by Legacy-GbE
Chapter 11
Apparatus Forecast
- Total Apparatus Forecast
- Fiber-Copper Apparatus Segment Forecast
- Fiber Apparatus Forecast
- Fiber Apparatus SFF-Legacy Connector Segment Forecast
- Fiber Cross Connect Volume Forecasts
- Fiber Cross Connect Volume Forecast by SM-MM
- Fiber Cross Connects Volume Forecast by SFF-Legacy Connectors
- Fiber Outlet Volume Forecast by SM-MM
- Fiber Outlet Forecast by SFF-Legacy Connectors
- Copper Apparatus Market Forecast
- Copper Apparatus Forecasts by Cross Connects-Outlets
- Copper Cross Connect Volume Forecast by Categories
- Copper Outlet Volume Forecast by Categories
Table of Figures
Chapter 3
Figure 3.1 Historical High Performance UTP Cable Shipments
Figure 3.2 Historic High Performance UTP Cable Growths
Figure 3.3 Ethernet Evolution
Chapter 8
Figure 8.1 Total SCS Market Forecast
Figure 8.2 SCS Market by Media Type Forecast $(M)
Figure 8.3 SCS Market by Media Type Forecast Trends
Figure 8.4 SCS Market by Media Types Year-to-Year Growths
Figure 8.5 SCS Market by Product Type Forecast
Figure 8.6 SCS Market by Product Type Shipment Trends
Chapter 9
Figure 9.1 Total Port Forecasts
Figure 9.2 Total Data Port Forecast by Media Type
Figure 9.3 Total Port Shipment Trends
Figure 9.4 Fiber Port Forecasts by Application
Figure 9.5 Fiber Port Shipments by Application Trends
Figure 9.6 Fiber Port Forecasts by GbELegacy
Figure 9.7 Fiber Port Shipments by Legacy- GbE Trends
Figure 9.8 Riser Fiber Port Forecast by Legacy-GbE
Figure 9.9 Riser Fiber Port Shipments by Legacy-GbE Trends
Figure 9.10 Campus Fiber Port Forecast by Legacy-GbE
Figure 9.11 Campus Fiber Port Shipments by Legacy-GbE Trends
Figure 9.12 FTTZ Fiber Port Forecast by Legacy-GbE
Figure 9.13 FTTZ Fiber Port Shipments by Legacy-GbE Trends
Figure 9.14 FTTD Fiber Port Forecast by Legacy-GbE
Figure 9.15 FTTD Fiber Port Shipments by Legacy-GbE
Figure 9.16 Data Center Fiber Port Forecast by Legacy-GbE
Figure 9.17 Data Center Fiber Port Shipments by Legacy-GbE Trends
Figure 9.18 Wireless Fiber Port Forecast by Legacy-GbE
Figure 9.19 Wireless Fiber Port Shipments by Legacy-GbE Trends
Figure 9.20 Copper Port Forecast by Cable Categories
Figure 9.21 Copper Port Shipment by Category Trends
Chapter 10
Figure 10.1 Total Cable Forecast
Figure 10.2 Fiber-Copper Cable Value Forecast
Figure 10.3 Cable Shipment Copper-Fiber Split Trends
Figure 10.4 Fiber Cable Volume Forecast & Growth
Figure 10.5 Fiber Cable Volume Forecast by Applications
Figure 10.6 Fiber Cable Volume by Application Shipment Trends
Figure 10.7 Fiber Cable Volume by Legacy-GbE
Figure 10.8 Fiber Cable Volume by Legacy-GbE Shipment Trends
Figure 10.9 Fiber Cable Volume Forecast by SM-MM
Figure 10.10 Fiber Cable Volume by SMMM Shipment Trends
Figure 10.11 Fiber Cable Value Forecast by SM-MM
Figure 10.12 Fiber Cable Value Forecast by SM-MM Shipment Trends
Figure 10.13 Fiber Cable Value Forecast by Applications
Figure 10.14 Fiber Cable Value by Application Shipment Trends
Figure 10.15 Copper Cable Volume Forecast by Category
Figure 10.16 Copper Cable Volume by Category Shipment Trends
Figure 10.17 Copper Cable Volume Forecasts by Legacy-GbE
Figure 10.18 Copper Cable Volume by Legacy-GbE Shipment Trends
Figure 10.19 Copper Cable Volume Forecast by Plenum – Non-Plenum
Figure 10.20 Copper Cable Value Forecast by Category
Figure 10.21 Copper Cable Value by Category Shipment Trends
Figure 10.22 Copper Cable Value Forecast by Legacy-GbE
Figure 10.23 Copper Cable Value by Legacy-GbE Shipment Trends
Chapter 11
Figure 11.1 Total Apparatus Market Forecast
Figure 11.2 Total Apparatus Market Forecast & Growths
Figure 11.3 Fiber-Copper Apparatus Segment Shipment Trends
Figure 11.4 Total Fiber Apparatus Forecast & Growths
Figure 11.5 Fiber Apparatus Forecast by Product Segments
Figure 11.6 Fiber Apparatus by Product Shipment Trends
Figure 11.7 Fiber Apparatus Forecast by SFF-Legacy Connectors
Figure 11.8 Fiber Apparatus SFF-Legacy Connector Shipment Trends
Figure 11.9 Fiber Cross Connect Volume Forecast
Figure 11.10 Fiber Cross Connect Volume Forecast by SM-MM
Figure 11.11 Fiber Cross Connect Volume Shipments by SM-MM Trends
Figure 11.12 Fiber Cross Connect Volume Forecast by SFF-Legacy Connectors
Figure 11.13 Fiber Cross Connect Volume by SFF-Legacy Connector Shipment Trends
Figure 11.14 Fiber Outlet Volume Forecast by SM-MM
Figure 11.15 Fiber Outlet by SM-MM Shipment Trends
Figure 11.16 Fiber Outlet Volume Forecast by SFF-Legacy Connectors
Figure 11.17 Fiber Outlet by SFF-Legacy Connector Shipment Trends
Figure 11.18 Copper Apparatus Forecast
Figure 11.19 Copper Apparatus Forecast by Category
Figure 11.20 Copper Apparatus by Product Segment Forecast
Figure 11.21 Copper Cross Connect Volume Forecast by Category
Figure 11.22 Copper Outlet Volume Forecast by Category
TOP
|