Overview:
We read a great deal about 5G in the local papers and hear about it almost every night on TV news. Most of what we read and hear is, at best, confusing and, too often, misleading and downright wrong!
Carrier A claims to be the first in the country;
Carrier B claims to be the first in the country;
Carrier C claims the fastest service:
One carrier is suing another carrier for false advertising;
This company is barred from the US because of spying accusations;
We see claims for 5G, even at the Super Bowl;
Major carriers are talking, but not investing.
What’s going on?
So what is the truth? What exactly is 5G’s status? Who is really deploying and investing like they are talking? What developmental issues remain? Who is going to pay for this development and deployment?
This comprehensive Report considers these issues and ultimately suggests the likely scenario for 5G deployment in this country. All based on our current viewpoint from about one year of deployment experience in the US. The Report also describes and explains 5G from many perspectives, including objectives, frequency plans, architecture, and a discussion of the vendors involved in the various parts of 5G infrastructure - phones, radios, and chipsets.
However, the primary burden of this Report is to forecast and quantify the many aspects of 5G activity in the US, distinguishing between the types of 5G The Report attempts to make sense of the competing and conflicting information we are receiving daily about this subject. The Report gives a great deal of consideration to the question of investment expenditures (capital expenditures) for this service and the mixed messages coming from the major US carriers. A projection is made of the likely path forward for the major carriers as regards 5G investment. The final main section builds on the previous parts of the Report to provide specific forecasts for 5G in the US and the impact of those forecasts on overall network requirements. Those forecasts include:
The fundamental forecast deployment scenario and these other forecasts support or build on that scenario:
- US Traffic – Total and Mobile
- US Mobile Carriers Forecast Growth
- 5G Phones Availability and Sources
- IoT 5G Impact
- Autonomous Vehicles 5G Impact
- Over Build/ Cross-Boundary Forecast
- US 5G Penetration Forecast by Major Service
- 5G Overall likely implementation plan and timeline
The Report includes a discussion of the recent purchase by Apple of Intel 5G assets and the likely impact that will have on Apple 5G developments. Also included is an analysis of the Department of Justice’s approval of the T-Mobile/Sprint merger, the implications for a Dish 5G network, and the very recent subsequent re-assignment of this issue to the courts. Included is the analysis of the impact of 5G deployment of each of these current legal events.
The Report presents, in detail, IoT and Autonomous Vehicles as two possible use cases often mentioned for 5G. This Report also examines the possibility of much higher levels of competition for very high-speed Internet (and other fixed services) enabled through 5G fixed wireless.
Appendixes provide details of the possible use cases and discuss the history of cellular development in the US. They also describe in some detail how we have moved step-by-step along the path from one generation of mobile communication to the next. For reference, the Appendixes also include various data and traffic issues.
Table of Contents
| Table of Contents | 3 |
| Table of Figures | 8 |
| INTRODUCTION | 10 |
| WHAT IS 5G? | 12 |
| Rationale for 5G | 12 |
| Developmental Needs | 14 |
| Cross-band Phones | 14 |
| Interior Penetration of mmWave | 14 |
| Infrastructure Deployment Aids | 15 |
| Support Systems | 15 |
| Types of 5G | 15 |
| Millimeter-wave 5G | 16 |
| Mid-band 5G | 16 |
| Location Types of 5G | 16 |
| Stationary | 16 |
| Mobile | 17 |
| Economics | 18 |
| WHAT ARE THE CHARACTERISTICS OF 5G? | 19 |
| Higher Capacity | 19 |
| Higher Data Rate | 20 |
| Lower Latency | 21 |
| Massive Device Connectivity | 22 |
| Reduced Costs | 24 |
| Consistent Quality of Experience Provisioning | 25 |
| STATUS OF 5G - PRIMARY US CARRIERS | 26 |
| Verizon Wireless | 26 |
| Verizon 5G Deployment Status | 27 |
| AT&T Mobility | 28 |
| AT&T 5G Deployment Status | 29 |
| T-Mobile US | 30 |
| T-Mobile US 5G Deployment Status | 31 |
| Sprint Corporation | 32 |
| T-Mobile US 5G Deployment Status | 33 |
| T-Mobile and Sprint Merger | 34 |
| Dish Network | 35 |
| INVESTMENTS FOR 5G | 36 |
| What Investments Are Involved in Infrastructure? | 36 |
| Spectrum | 36 |
| Cell Site Work and Additions | 36 |
| Transmission | 37 |
| Network Core | 37 |
| Support Systems | 37 |
| How Much Will Infrastructure Investments Cost? | 38 |
| How Much Are the Major Telcos Going to Spend on 5G Infrastructure? | 38 |
| ARCHITECTURE OF 5G | 42 |
| 5G Network Cooperation | 43 |
| 5G Frequency Plans | 43 |
| Various Cell Sizes for 5G Networks | 44 |
| 5G Network Architecture and Application Illustrations | 45 |
| 5G Infrastructure Components | 47 |
| Small Cell Antennas | 47 |
| MIMO | 48 |
| MIMO and 5G | 48 |
| Massive MIMO Spectrum Multiplying Advantage | 49 |
| Fiber | 51 |
| Verizon Fiber Plan for 5G | 52 |
| Phones | 53 |
| 5G Phones | 54 |
| Quick Look | 54 |
| Android Based Phones | 54 |
| Apple | 55 |
| Samsung | 55 |
| LG | 55 |
| Huawei | 56 |
| Other Customer Access Devices | 56 |
| Radio Equipment Manufactures | 56 |
| Huawei | 56 |
| Ericsson | 57 |
| Nokia | 57 |
| ZTE | 58 |
| Samsung | 58 |
| Chip Set Vendors | 58 |
| Intel | 58 |
| Qualcomm | 59 |
| Samsung | 59 |
| Apple | 60 |
| Huawei | 60 |
| 5G FORECASTS | 61 |
| Forecast Deployment Scenario | 61 |
| 2019 | 61 |
| 2020 | 62 |
| 2021 | 62 |
| 2022 and Later | 62 |
| Timeline | 62 |
| Capital Forecast for 5G | 63 |
| Individual Area Forecasts | 64 |
| Mobile Traffic Forecast | 64 |
| US Mobile Carriers Forecast | 66 |
| 5G Penetration Forecast – US | 67 |
| Smartphone Growth Forecast for 5G - the US | 70 |
| 5G Phone Introduction Plans | 71 |
| 5G US Penetration Forecast - Phones | 72 |
| Major Use Cases of 5G – Penetration Forecast | 73 |
| IoT – Internet of Things – 5G Penetration Forecast | 73 |
| Autonomous Vehicles – 5G Penetration Forecast | 74 |
| Forecast Network Impact of Autonomous Vehicles and IoT | 75 |
| Over-Build Forecast | 75 |
| Forecast Summary | 76 |
| Traffic: | 76 |
| US Mobile Carriers: | 76 |
| Phones: | 76 |
| 5G Penetration: | 76 |
| IoT: | 77 |
| Autonomous Vehicles: | 77 |
| Overbuild/ Cross-Boundary: | 77 |
| APPENDIX I - HISTORY OF GENERATIONS OF CELLULAR PHONES IN THE USA | 78 |
| HISTORY OF CELLULAR PHONES IN THE US | 78 |
| What are the Generations? | 78 |
| 1st Generation | 79 |
| 1G Standards | 79 |
| 2nd Generation | 79 |
| 2G Standards | 80 |
| 3rd Generation | 80 |
| High-Speed Downlink Packet Access - | 80 |
| 3GPP Long Term Evolution, the Precursor of LTE Advanced – | 81 |
| Evolved HSPA | 81 |
| 3G Standards | 81 |
| 4th Generation | 82 |
| LTE Advanced | 82 |
| MIMO | 82 |
| 4G Standards | 83 |
| 5th Generation | 83 |
| 5G Standards | 83 |
| APPENDIX II. MAJOR USE CASES FOR 5G: IOT, AUTONOMOUS VEHICLES, OVERBUILD | 85 |
| IoT - The Internet of Things | 85 |
| Availability of a Network for Connection – a Major Problem with IoT | 86 |
| Cellular IoT Connections Explained: NB-IoT vs. LTE-M vs. 5G and More | 86 |
| How did Cellular IoT come to Be? | 87 |
| Cellular IoT is meant to meet the requirements of low-power, long-range applications. | 88 |
| Cat-1 | 88 |
| Cat-0 | 88 |
| Cat-M1/Cat-M/LTE-M | 88 |
| NB-IoT/Cat-M2 | 88 |
| EC-GSM (formerly EC-EGPRS) | 88 |
| 5G as an IoT Connection Solution | 89 |
| How Does 5G Enable IoT? | 89 |
| Autonomous Vehicles | 89 |
| Autonomous Vehicles Benefits | 89 |
| Current Versions of Autonomy | 90 |
| Issues with Autonomous Development | 90 |
| Safety | 91 |
| Business Case | 91 |
| Availability of a Network for Interconnection | 92 |
| Overbuild - 5G as a Major Competitive Tool | 93 |
| Overbuilding | 94 |
| Cross-Boundary Service | 94 |
| Competitive Implications | 94 |
| APPENDIX III - LIST OF US CELLULAR CARRIERS | 96 |
| Contiguous US and Hawaii] | 99 |
| Alaska | 99 |
| APPENDIX IV - TRAFFIC STATISTICS RELATIONSHIPS | 100 |
| SONET/SDH Data Rates | 101 |
| APPENDIX V DATA TRAFFIC FUNDAMENTALS | 103 |
| Internet Traffic Calculations | 104 |
| Bits and Bytes | 105 |
| Transfer Rate | 105 |
| Busy Hour Traffic | 106 |
| Protocol Efficiencies | 107 |
| Statistical Multiplexing | 107 |
| Peaking | 107 |
| APPENDIX VI THE LIGHTWAVE NETWORK SERIES OF REPORTS | 109 |
| The Lightwave Network | 109 |
| The Lightwave Series of Reports | 110 |
| General Reports on the Network | 111 |
| General Market Reports | 111 |
| Specific Systems Reports | 114 |
Table of Figures
| Figure 1, 5G Download Speeds | 13 |
| Figure 2, Fixed Wireless 5G | 17 |
| Figure 3, 5G Capacity Capabilities | 19 |
| Figure 4, Theoretical 5G Speed | 20 |
| Figure 5, Standards Evolution from 4G to 5G | 21 |
| Figure 6, Lower Latency Triangle - 5G | 22 |
| Figure 7, IoT Sensing Points Explosion | 22 |
| Figure 8, 5G Connection Capabilities | 23 |
| Figure 9, US Major Mobile Carriers (Subscribers) | 26 |
| Figure 10, Verizon Coverage Map | 27 |
| Figure 11, AT&T Coverage Map | 28 |
| Figure 12, T-Mobile Coverage Map | 30 |
| Figure 13, Sprint Coverage Map | 32 |
| Figure 14, Size of Major Mobile Carriers after Merger '000s (end of 2017- 2019 data) | 34 |
| Figure 15, Major Telco Capital Expenditures 2013-2018 | 38 |
| Figure 16, 5G Overall Layout | 42 |
| Figure 17, Cell/Technology Cooperation | 43 |
| Figure 18, 5G Frequency Allocation – US | 44 |
| Figure 19, Cell Types from Macro to Small | 45 |
| Figure 20, 5G Pictorial Architecture | 46 |
| Figure 21, 5G Infrastructure Applications | 46 |
| Figure 22, Different Types of Antennas to be Used with 5G | 47 |
| Figure 23, MIMO Multipath Propagation Increases Thru-Put | 48 |
| Figure 24, Depiction of Massive MIMO | 48 |
| Figure 25, Example of MIMO Antenna | 50 |
| Figure 26, 5G Layout Showing Fiber Connections | 51 |
| Figure 27, Graphical Illustration of Fiber's Place in a 5G Network | 52 |
| Figure 28, Smartphone Growth in US | 53 |
| Figure 29, 5G Phones and Carrier | 54 |
| Figure 30, 5G Forecast Timeline | 63 |
| Figure 31, Capital Expenditure Forecast | 64 |
| Figure 32, Major Data Traffic Sources | 65 |
| Figure 33, US Mobile Phone Data Traffic | 66 |
| Figure 34, US Major Mobile Carriers Forecast | 66 |
| Figure 35, 5G Penetration - One Forecast | 67 |
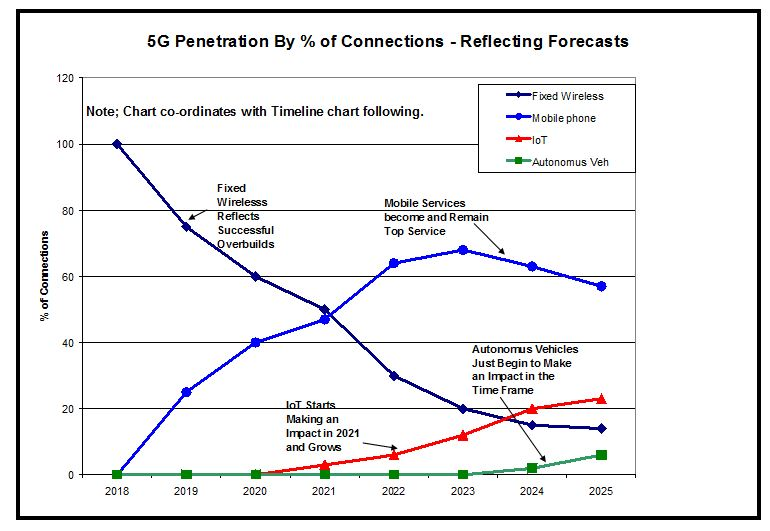
| Figure 36, 5G Penetration Forecast by Major Application | 68 |
| Figure 37, Smartphones as a Proportion of Total US Mobile Phones (all types) | 70 |
| Figure 38, Landlines are a Dying Bread | 70 |
| Figure 39, US Smartphone Shipments | 72 |
| Figure 40, Smartphone Penetration Forecast | 72 |
| Figure 41, IoT Sense Point Forecast | 73 |
| Figure 42, Network Impact of Autonomous Vehicles and IoT | 75 |
| Figure 43, Wireless Penetration by Generation and Forecast | 78 |
| Figure 44, Network Generations Timeline | 84 |
| Figure 46, Cellular Approaches to IoT Connections | 86 |
| Figure 47, Goals of 5G | 89 |
| Figure 48, Some Current Partially Autonomous Versions | 90 |
| Figure 49, Verizon's NOOF FiOS Service | 94 |
| Figure 50, 5G Cross Boundary Service Example | 95 |
| Figure 51, Fixed Broadband Service Providers - US | 97 |
| Figure 52, Fixed Wireless Depiction | 98 |
| Figure 53: Traffic/Speed Relationships | 101 |
| Figure 54: Example of Various Traffic Sizes | 102 |
| Figure 55, Multiples of Byte | 102 |
| Figure 56, Wavelength to Frequency Conversion Chart | 103 |
| Figure 57, Sonet/SDH Conversions | 103 |
| Figure 58: New Transfer Rate Forecast | 105 |
| Figure 59: Summary of Concepts | 108 |
| Figure 60, Lightwave Network | 109 |
|

